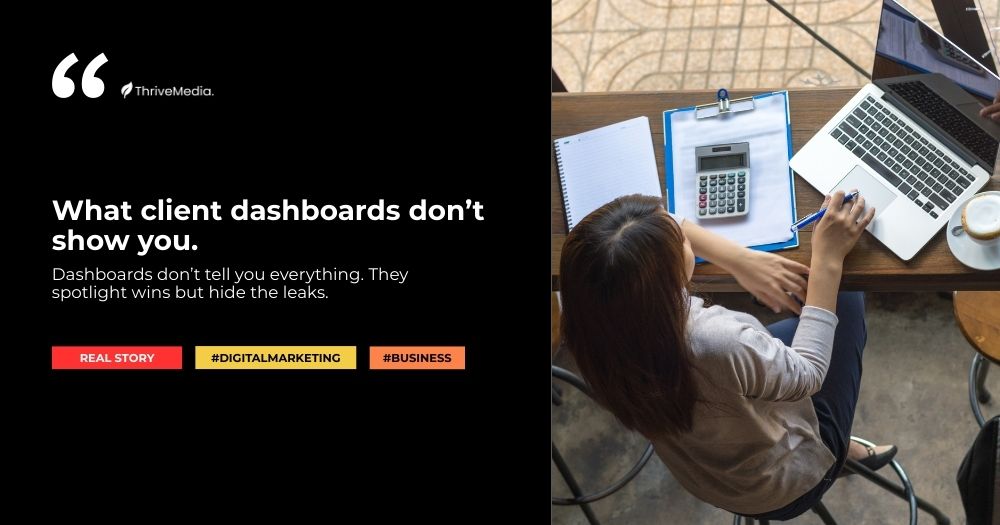
If you’ve ever worked with a digital marketing agency, you’ve probably seen a client dashboard filled with colorful graphs, conversion numbers, and CPC trends. At first glance, these dashboards look impressive. They promise transparency and insights. But here’s the problem—what client dashboards don’t show you often matters more than what they do.
Dashboards can be great at summarizing data, but they rarely tell the whole story. And when you rely only on what’s presented, you might miss blind spots that cost your business thousands of dollars in wasted ad spend.
This article breaks down the gaps in dashboards, why SMEs in Singapore (and Southeast Asia) are more vulnerable, and what business owners should watch for. We’ll dive into real-world benchmarks, case studies, and data so you can make better decisions about your ad spend.
At first, it feels like you’re seeing everything. But this is like looking at the tip of the iceberg.
What’s often hidden:
• Lead Quality – Are these enquiries actually converting to paying customers? • Lifetime Value (LTV) – Does one customer spend $200 or $2,000? • Offline conversions – Did the lead call your centre or walk in later? • Competitor activity – Your CPC spike may be driven by new aggressive bidders.
As HubSpot warns, dashboards that aren’t tied to revenue insights are “vanity metrics.” They make you feel good, but they don’t help you grow profitably.
On a dashboard, all three look like “success.” They drive clicks and leads. But only one of them truly reduces cost per enrolment sustainably.
Dashboards often miss: • The context behind why targeting works. • The long-term cost per enrolment (CPE), not just CPL.
That’s why you need reporting that drills into conversion quality—not just quantity. For more strategies, see Location targeting strategies for enrichment centres.
Hero Section - Boost Enrollment
Boost Sales With Thrive's Digital Strategy
Connect with our expert team to transform your sales process with proven digital marketing strategies that deliver real results.
Not necessarily. They’re just incomplete. Dashboards simplify data, but they rarely reveal customer lifetime value, offline conversions, or competitor effects.
Why does my dashboard show good CTR but no sales?
Because clicks don’t equal revenue. A Forbes study showed that 62% of SMEs tracked only CTR, not conversion quality.
Can I lower CPC just by changing my bid?
Not sustainably. You’ll need to improve Quality Score, targeting, and ad relevance. Otherwise, CPCs creep back up.
Should I only focus on lowering CPC?
No. CPC is just one metric. Focus on Cost per Enrolment (CPE) or Cost per Acquisition (CPA).
• Ask for lead quality reports, not just lead quantity. • Demand call tracking and offline conversion integration. • Request competitor benchmarking data (SEMRush, SimilarWeb). • Tie every dashboard number to revenue outcomes, not vanity stats.
When you align reporting with business outcomes, your ad spend starts to work harder.
• Dashboards often hide the bigger story. • Don’t get blinded by vanity metrics like CTR and impressions. • Focus on real ROI metrics—CPE, CPA, and LTV. • Always push for context, not just numbers.
With the right perspective, you’ll avoid traps that many SMEs in Singapore fall into.
Lets built the Perfect Sales Funnel Together
Your business deserves more. Let ThriveMediaSG help your business Increase Sales through digital marketing.
Understand what client dashboards don’t show you and how SMEs in Singapore can avoid common reporting pitfalls.
Are dashboards lying to me?
No. They aren’t built to deceive you, but they are incomplete. Dashboards simplify data into clicks and conversions while hiding lead quality, LTV, and competitor effects.
Why does my dashboard show good CTR but no sales?
Because clicks don’t equal revenue. High CTR often means traffic, but not necessarily qualified leads who convert into paying customers.
Can I lower CPC just by changing my bid?
No. Bid changes only create short-term effects. Sustainable CPC reductions come from improving ad quality, targeting, and relevance.
Should I only focus on lowering CPC?
No. CPC is just one metric. Cost per Acquisition (CPA) or Cost per Enrolment (CPE) matter more for long-term profitability.
Why do agencies push vanity metrics?
Because vanity metrics like clicks and impressions look good in reports. They’re easier to present, but they don’t reflect true ROI.
What key data is usually missing from client dashboards?
Lead quality, lifetime customer value, offline conversions, and competitor insights are often absent from dashboards.
How can I track lead quality beyond dashboards?
Use call tracking, CRM integration, or sales team feedback to verify which leads actually close and generate revenue.
Do dashboards show competitor actions?
No. Most dashboards don’t. CPC changes are often influenced by competitors, but tools like SEMrush or Auction Insights reveal this better.
How do dashboards handle offline conversions in Singapore?
Many don’t. Walk-ins or calls aren’t tracked. You need offline conversion tracking or CRM uploads to connect ads to sales.
Can I customize dashboards to show more meaningful metrics?
Yes. Ask your agency to integrate with CRM, call tracking, and revenue systems so dashboards show ROI, not just activity.
Why do SMEs in Singapore fall for dashboard traps?
Because budgets are tight and vanity numbers look reassuring. In high CPC industries, dashboards hide wasteful spend.
What’s the best way to use dashboards without being misled?
Treat dashboards as a starting point. Always ask follow-ups like lead quality, CPA, and competitor impact before deciding.
Trusted by leading startups & enterprises
Why Your Business Matter to ThriveMedia?
Our team consists of seasoned digital marketers, bringing years of hands-on expertise driving results for SMEs and enterprises throughout the APAC region.
✓ We Track Every Step
from first click to final sale—across Meta, Google, TikTok, YouTube, and your CRM so you can see what’s working and what’s not.
✓ We handle everything in-house.
Your videos, landing pages, ads, and data are aligned under one strategy no more juggling vendors.
✓ We adapt instantly.
Budgets shift based on real-time performance, not monthly meetings.
✓ We make your existing data work harder.
Leads and traffic you already have get optimized for higher ROI and less waste.
✓ We keep it real.
Clear reports, honest feedback, and no jargon—even when results aren’t perfect.
Digital Marketing isn’t just about running ads—it’s about turning data into visible growth.